Content H1

WELLAND OVERVIEW
A snap-shot of information about Welland collected into one location so that you can quickly and easily find key data highlights. For more detailed information regarding Welland’s major sectors, labour force, and demographics, check out the Reports section
GEOGRAPHY
- WELLAND POPULATION (2021): 55,750
- NIAGARA POPULATION (2021): 484,453
- COORDINATES: 42.9922° N, 79,2483° W
- WELLAND LAND AREA: 81.09 sq.km.
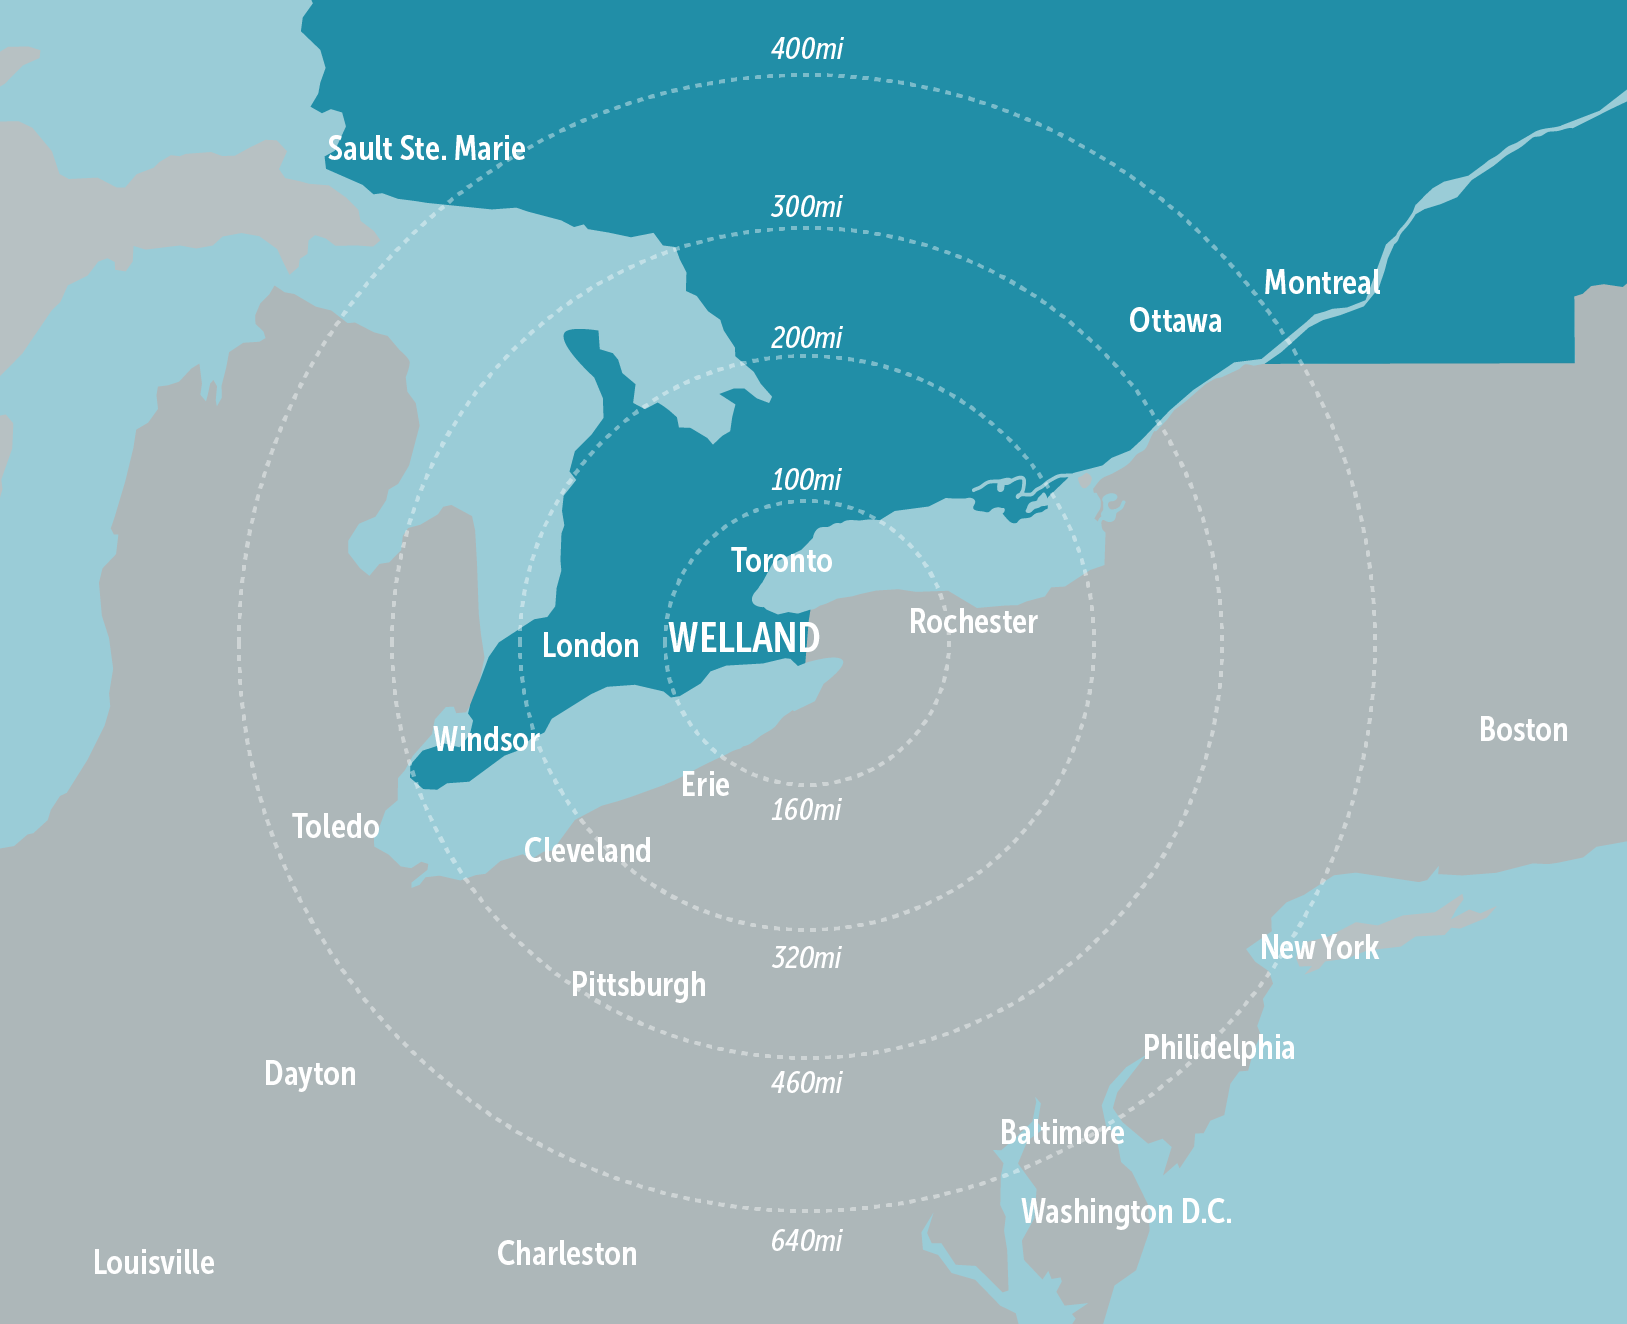
- PROXIMITY TO MAJOR CENTRES:
| Centres | kilometres | miles |
|---|---|---|
| Buffalo, NY | 55 | 34 |
| Chicago, IL | 929 | 577 |
| Detroit, MI | 390 | 242 |
| Hamilton, ON | 53 | 33 |
| Montreal, PQ | 689 | 428 |
| New York, NY | 750 | 466 |
| Philadelphia, PA | 720 | 447 |
| Pittsburgh, PA | 428 | 266 |
| Toronto, ON | 111 | 69 |
| Washington, DC | 802 | 498 |
TRANSPORTATION NIAGARA


WELLAND'S LABOUR MARKET
| Participation Rate | 57.5% |
| Unemployment Rate | 8.8% |
Source: Statistics Canada 2016 Census

| By Sector | Welland Residents | Niagara Residents |
|---|---|---|
| Accommodation & Food Services | 1,215 | 21,969 |
| Administrative & Support, Waste Management & Remediation Services | 983 | 9,824 |
| Agriculture, Forestry, Fishing & Hunting | 81 | 5,365 |
| Arts, Entertainment & Recreation | 232 | 5,945 |
| Construction | 593 | 10,122 |
| Educational services | 2,784 | 14,972 |
| Finance and Insurance | 728 | 4,742 |
| Health Care & Social Assistance | 3,486 | 24,999 |
| Information and Cultural Industries | 123 | 1,851 |
| Management of Companies & Enterprises | 72 | 441 |
| Manufacturing | 1,307 | 14,540 |
| Other Services (Except Public Administration) | 678 | 6,534 |
| Professional, Scientific & Technical Services | 439 | 7,044 |
| Public Administration | 798 | 9,915 |
| Real Estate & Rental and Leasing | 217 | 2,041 |
| Retail Trade | 2,322 | 24,076 |
| Transportation and Warehousing | 396 | 7,503 |
| Utilities | 67 | 1,260 |
| Wholesale Trade | 467 | 7,639 |
Source: Statistics Canada 2021 Census
| Top 10 Sectors | Jobs |
|---|---|
| Health Care and Social Assistance | 3,692 |
| Educational Services | 2,891 |
| Retail Trade | 2,452 |
| Manufacturing | 1,347 |
| Accommodation and food services | 1,225 |
| Administrative and support, waste management and remediation services | 1,041 |
| Public administration | 798 |
| Finance | 779 |
| Construction | 1,213 |
| Professional, scientific and technical services | 802 |
Source: EMSI 2022.07 Dataset
| Top 5 Manufacturing Segments | 2021 |
|---|---|
| Steel product manufacturing from purchased steel | 221 |
| Other general-purpose machinery manufacturing | 180 |
| Iron and steel mills and ferro-alloy manufacturing | 137 |
| Architectural and structural metals manufacturing | 66 |
| Semiconductor and other electronic component manufacturing | 42 |
Source: EMSI Dataset 2021
| Top Employers | Employees (FT/PT) |
|---|---|
| Canadian Tire Financial Services | 1,460 |
| Niagara Health System - Welland Site | 900 |
| Niagara College Canada | 530 |
| RATESDOTCA | 350 |
| INNIO | 250 |
| Welded Tube of Canada | 250 |
| Bosch Rexroth Canada | 220 |
| Vesuvius Canada Inc. | 110 |
Welland Business Directory
WELLAND’S KEY SECTORS


POST SECONDARY EDUCATION
Niagara College by the Numbers
- 2 Campuses Welland & Niagara-on-the-Lake
- 65 Global Education and Partnership countries
- 130 Diploma, graduate certificate, apprenticeship & bachelor’s degree programs
- 600+ Credit, vocational and general interest programs
- 4,162 International students
- 11,071 Full-time students
- 15,000 Part-time students
Brock University by the Numbers
- 8 Canada Research Chairs
- 12 3M Teaching Fellowship Award Winners
- 20 Institutes & Research Centres
- 50 Graduate programs
- 70 Undergraduate programs
- 100+ Home countries for foreign students
- 600 Faculty Members
- 2,000 International students
- 19,708 Students Enrolled
- 24,000 Experiential learning opportunities including co-op placements
- 100,000+ Graduates
BUILDING ACTIVITY IN WELLAND
| 2020 | # Permits | Value |
|---|---|---|
| Residential | 626 | $136,466,985 |
| Commercial | 99 | $11,071,087 |
| Institutional | 24 | $10,031,900 |
| Industrial | 14 | $17,450,980 |
| Agriculture | 4 | $262,000 |
| 2021 | # Permits | Value |
|---|---|---|
| Residential | 901 | $179,477,407 |
| Commercial | 140 | $21,476,160 |
| Institutional | 37 | $11,824,977 |
| Industrial | 13 | $283,500 |
| Agriculture | 3 | $334,650 |
| 2022 | # Permits | Value |
|---|---|---|
| Residential | 892 | $201,793,992 |
| Commercial | 79 | $11,602,450 |
| Institutional | 41 | $4,829,580 |
| Industrial | 15 | $467,650 |
| Agriculture | 2 | $770,000 |
New Dwelling Units per year
| 2020 | 2021 | 2022 |
|---|---|---|
| 739 | 759 | 944 |