Welland’s diversified and experienced workforce
Welland’s strong labour force has ready-to-go experience and depth in precision machining, metal forming, electrical & connectivity, hydraulics and power distribution. The region excels in advanced manufacturing, aerospace, shipbuilding, logistics, transportation equipment and primary metal manufacturing.
Welland also has easy access to world-class automotive and advanced manufacturing research centres at Niagara College, McMaster University, the University of Waterloo and the University of Windsor.

Expected 20 Year Growth
2021 – 2041
55.8k – 103k
Population
+22,420
Housing Units
+4.8 Mil
Sq.ft of Commercial Growth
Workforce Collective Data
Population Trends
According to the 2021 Census, Welland was home to 55,750 people. From 2016-2021, Welland’s population grew by 6.6%, welcoming 3,457 new residents (see Table 1). Men made up 48.8% of the population, while women accounted for 51.2% in 2021 (Figure 1).
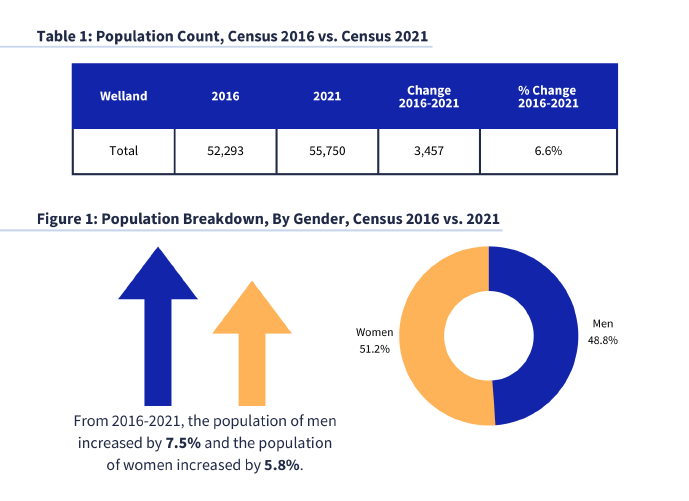
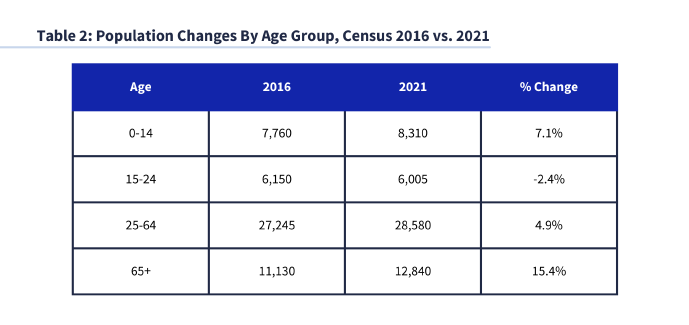
Table 2 presents Welland’s population by age group. All age groups increased between 2016 and 2021, except for the 15-24 age cohort which saw a decrease of 2.4%. The 65 and older age group experienced the largest increase (15.4%) followed by the 0-14 age cohort (7.1%).
Income
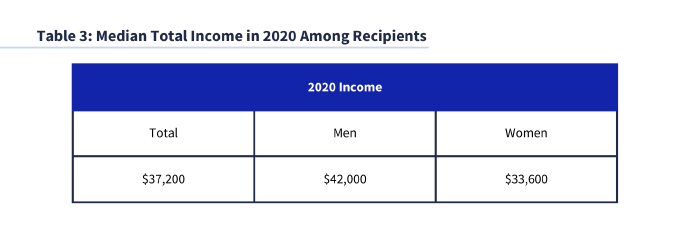
Table 3 shows the median total income for individuals living in Welland for the year 2020. women reported a median income of $33,600 compared with $42,000 for men.
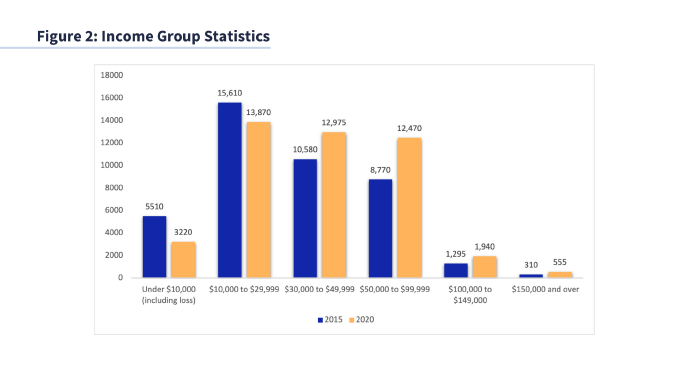
In 2020, the plurality of Welland’s residents was in the income group of $10,000 to $29,999, which decreased by 11.1 % between 2015 and 2020. We saw notable increases in the income groups of $30,000 – $49,999 and $50,000 – $99,999 (Figure 2).
Job Demand
We estimate job demand through the aggregation of public-facing, online job postings. Between January 2023 and August 2023, there were 3,616 on line job postings listed in Welland. The five most common occupations listed in Welland’s job postings are shown in Figure 3.
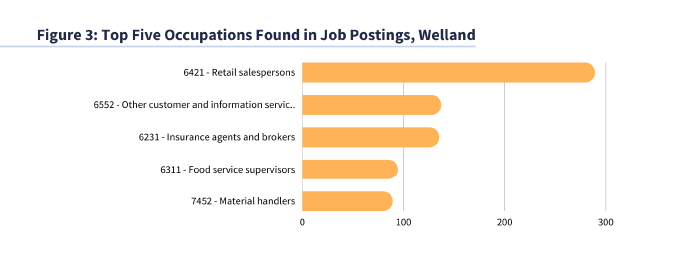
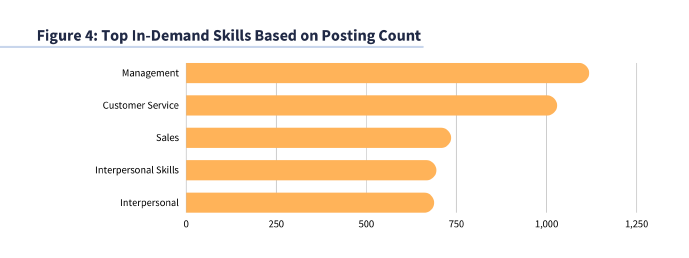
Figure 4 shows the most required skills across job postings between January 2023 and August 2023.
Jobs Profile
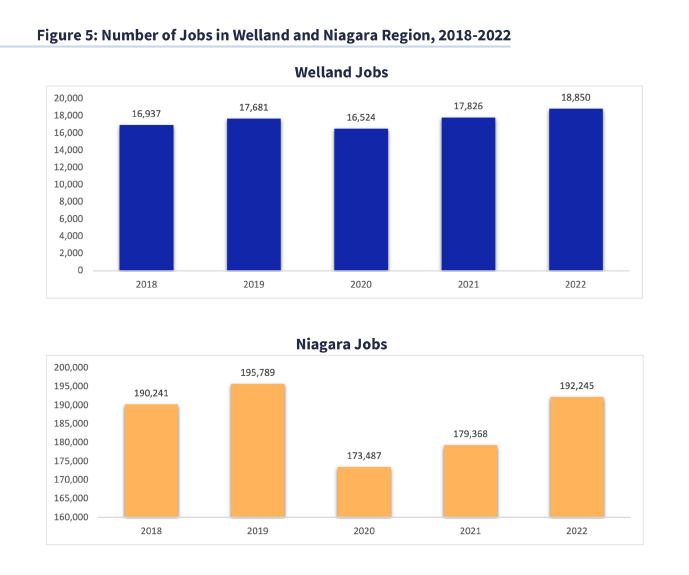
In 2022, there were 18,850 jobs in Welland, representing 9.8% of all jobs in Niagara. Welland gained 1,024 jobs (or 5.7%), between 2021 and 2022. This level of job growth was lower than the regional job growth of 7.2% during the same time (see Figure 5).
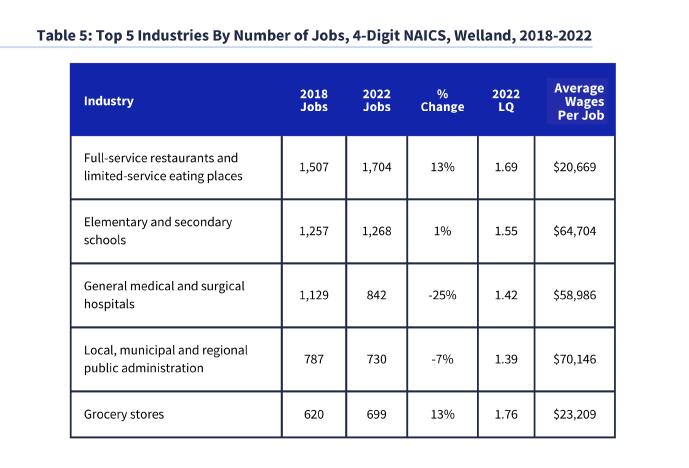
Industry, Occupations and Wages
Tables 4 and 5 present occupation and industry job counts, wages, and location quotients (LQ). An LQ greater than 1.0 indicates that an occupation/industry is more concentrated in Welland relative to Ontario as a whole.
Table 4 shows the top occupations in Welland by the number of jobs in 2022.
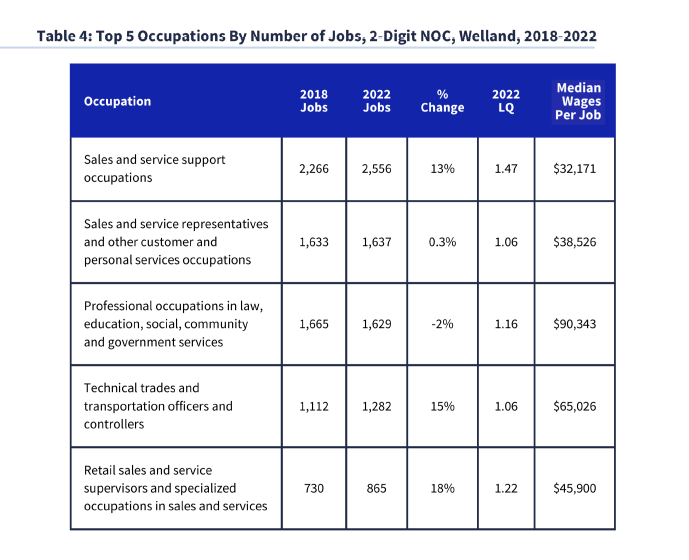
Table 5 presents the top 5 largest industries in Welland by number of jobs in 2022. These jobs make up 27.8% of all jobs in Welland.